Posted: November 10, 2013
Visualizing Variability
Background
I was recently invited to speak at a special session title Modeling and Simulation: What are the Fundamental Skills and Practices to Impart to our Students?. I gave a short talk titled "Beyond System Dynamics and State-Space" emphasizing things I thought were important to consider beyond the purely mathematical considerations necessary to prepare students for the usual controls courses.
After my talk, during a short panel discussion, someone from the audience said something to the effect of:
I can give my students a set of differential equations and they know how to convert turn those differential equations into a simulatable model. The problem is that they simulate the system and they think that the answer they get is the answer. They don't understand that there are all kinds of uncertainties to consider.
Of course, the main issue here is how to convey to students an understanding about what uncertainty is and to make sure it is taken into account. At least this is how I think the person making this point thought about it.
I had a slightly different take. I suppose this is no surprise since most of the audience and everyone on the panel (except me) were from academia. Their thinking was how to structure the curriculum.
But I looked at this a bit differently. I've worked on modeling of systems where there was stochastic information available to characterize the uncertainty of different parameters in the system. So I understand not only that uncertainty exists but also how to express it. But even then, it's still hard to understand the true implications of that uncertainty. Knowing that one parameter has an uncertainty that can be represented as a uniform distribution of some kind and another has an uncertainty that can be represented as a normal distrbution doesn't actually give us a sense of what the actual impact on the solution is.
I responded to this point by pointing out that distributed CPU power has become a commodity and that something like uncertainty provides a high degree of "coarse grained" parallelism. In other words, you could use "the cloud" to help with this problem. I've mentioed my FMQ Platform previously. This shapes a lot of how I look at this kinds of problems. It turns out that after my talk at DSCC, I was scheduled to speak at the recent Detroit FMI Tech Day event. I wanted to take this question from DSCC and put together an application that leveraged FMI and FMQ to show how we can approach visualizing uncertainty.
I chose the Lotka-Volterra model as my example. I did this mainly because they dynamics are interesting (limit cycle, non-linear) and easy to understand. These days, almost everything I do is centered around the web. So, naturally, I created a web application as the first step. I created a dialog for editing the parameters of the Lotka-Volterra model and connected it to the FMQ Platform to support simulation.
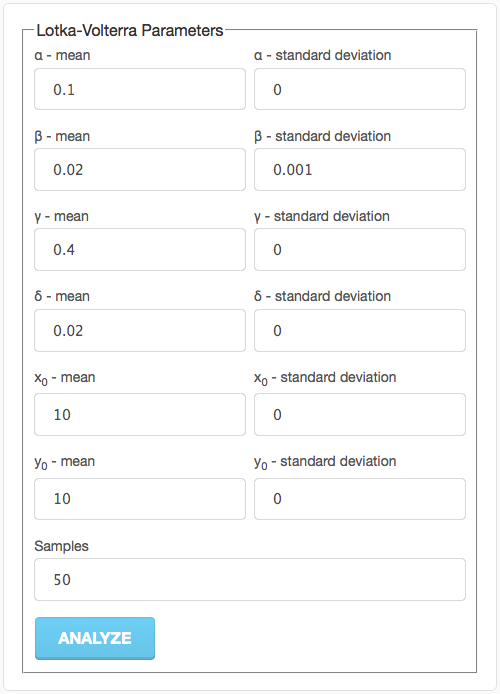
If you just simulate the Lotka-Volterra equations without any uncertainty, you'd fill the parameter dialog in as follows:

If you press the "Analyze" button, you'll get a plot like this:
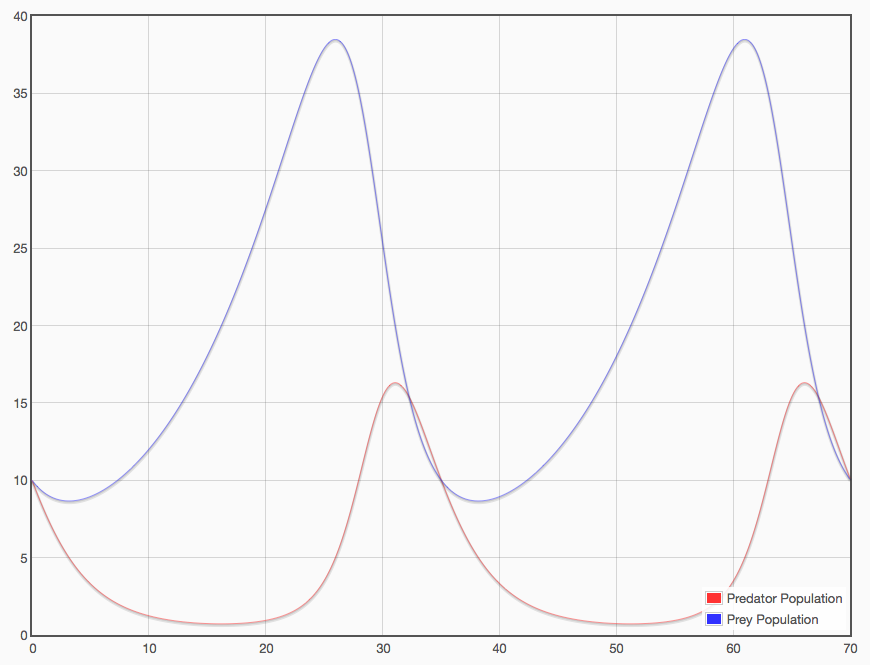
So this was exactly the point that was raised in the panel discussion. After running such a simulation, a student might look at this plot and think "OK, that's the answer". But, of course, it isn't. Because where did all those numbers in the parameter dialog come from? And more to the point, how accurate are they really?
So, let's modify the parameter dialog to include some uncertainties (specifically in the parameter affecting predation):
This will create a Monte-Carlo analysis where the baseline parameters are used and 50 additional simulations are done by generating parameters sets based on the uncertainty. In all, we'll get 51 different simulation results out of this analysis.
But the important point to understand here is that if you are using a distributed computing framework to run your analysis, the (wall clock) time it takes to run one analysis is the same as what it takes to run 51 (assuming you have the computing bandwidth to support 51 parallel jobs which, frankly, isn't very many). Cloud computing providers charge by CPU usage not concurrent usage. The important point is that running 51 jobs sequentially has the same cost as running 51 jobs in parallel.
Now if you press the "Analyze" button, you'll get a plot like this:
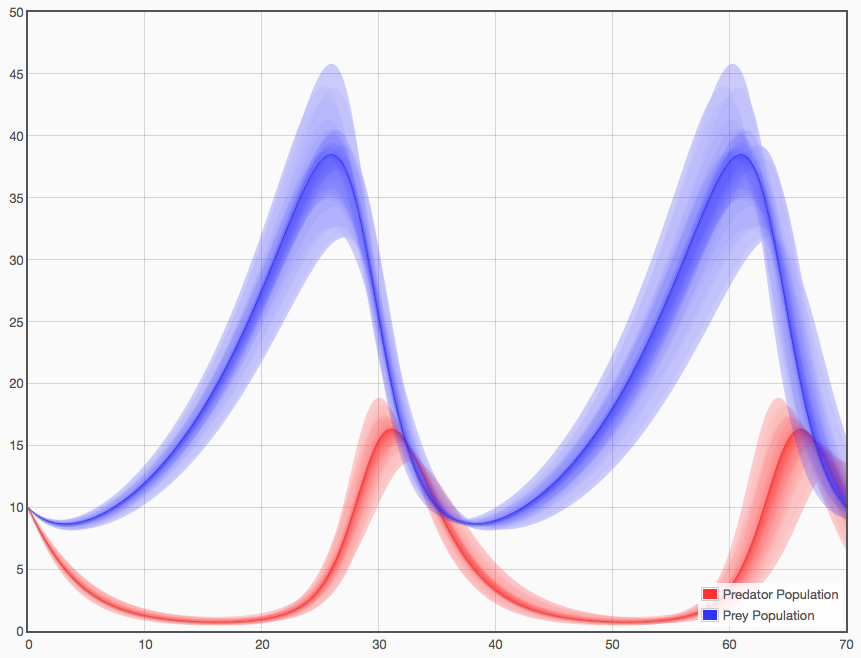
An important thing to note about this plot is the way coloring and opacity are used. If I had simply plotted each trajectory as a line, we'd have a nasty mess here. But instead, I plotted the baseline parameter set as a dark line of a given color and all the other trajectories involving uncertainty as a semi-transparent area between the uncertain result and the baseline result. If you run enough of these, you get a very interesting visualization where the shading gives a sense of the likelihood of passing through that point in state-space. Note that in addition to this "likelihood" dimension this type of visualization also conveys the "envelope" of the potential solutions (in much the way error bars would).
Of course, this opens up immediate questions. For example, what is the impact of initial conditions on these trajectories? So let's introduce a standard deviation of "1" on the initial values. In that case, the visualization looks like this:
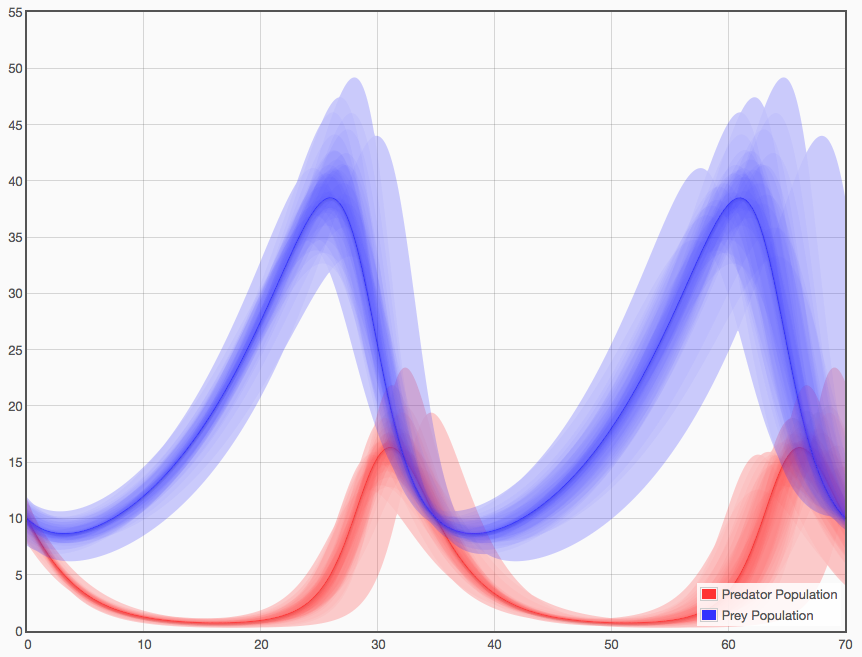
In this way, we can examine the effects of individual uncertainties or combine them together to see the net effect of several uncertainties acting in concert.
Conclusion
The point of this exerise is to show that with distributed computing resources, analyses like Monte-Carlo analysis become more attractive because they can be completed in nearly the same amount of time as a "normal" analysis and yet, with the right visualizations, they can convey a great deal of useful information.
So this started out as a question about explaining the concept of uncertainty to students. While there are important pedagogical aspects at the heart of this issue, it is important to also consider that technology itself can help greatly in this regard. But we have to understand what the technologies are capable of and how to use them effectively.
Share your thoughts
comments powered by Disqus